

The app was developed to help businesses overcome Covid, rising energy prices and inflation. I am not sure whether it counts as direct help, but it is certainly useful prevention. 🙂
What is it for?
The app analyses a company’s ability to repay liabilities, its stability and profitability. It should therefore give you details about your financial situation: its past, where it stands now and what to expect in future. For example, it can help with decisions on future investment. To me, it is also a useful assessment of how your company is doing. You can find the basis of the calculations here.
What do I need?
What you probably want to know is which data to load into the app. You can get it from two documents that your accountant should already have provided, without any complicated searching.
- Balance sheet – specifically: total assets, current assets, liabilities and short-term liabilities,
- Income statement (i.e. profit and loss statement) – specifically: revenue, interest expense and EBIT (or operating profit).
If you are our client, you will find both on your drive. However, you may be a micro-enterprise and therefore not obliged to submit a full balance sheet with your tax return, which runs to several pages rather than a few lines. In that case, your drive will only contain the abbreviated version, missing some of the required details. Write to us and we will happily extract the full version from the accounts. 🙂
How does it work?
Once you have everything ready, enter the figures mentioned above for the last three years into the app’s prepared tables. I tried it for you using data for a fictitious micro-enterprise.
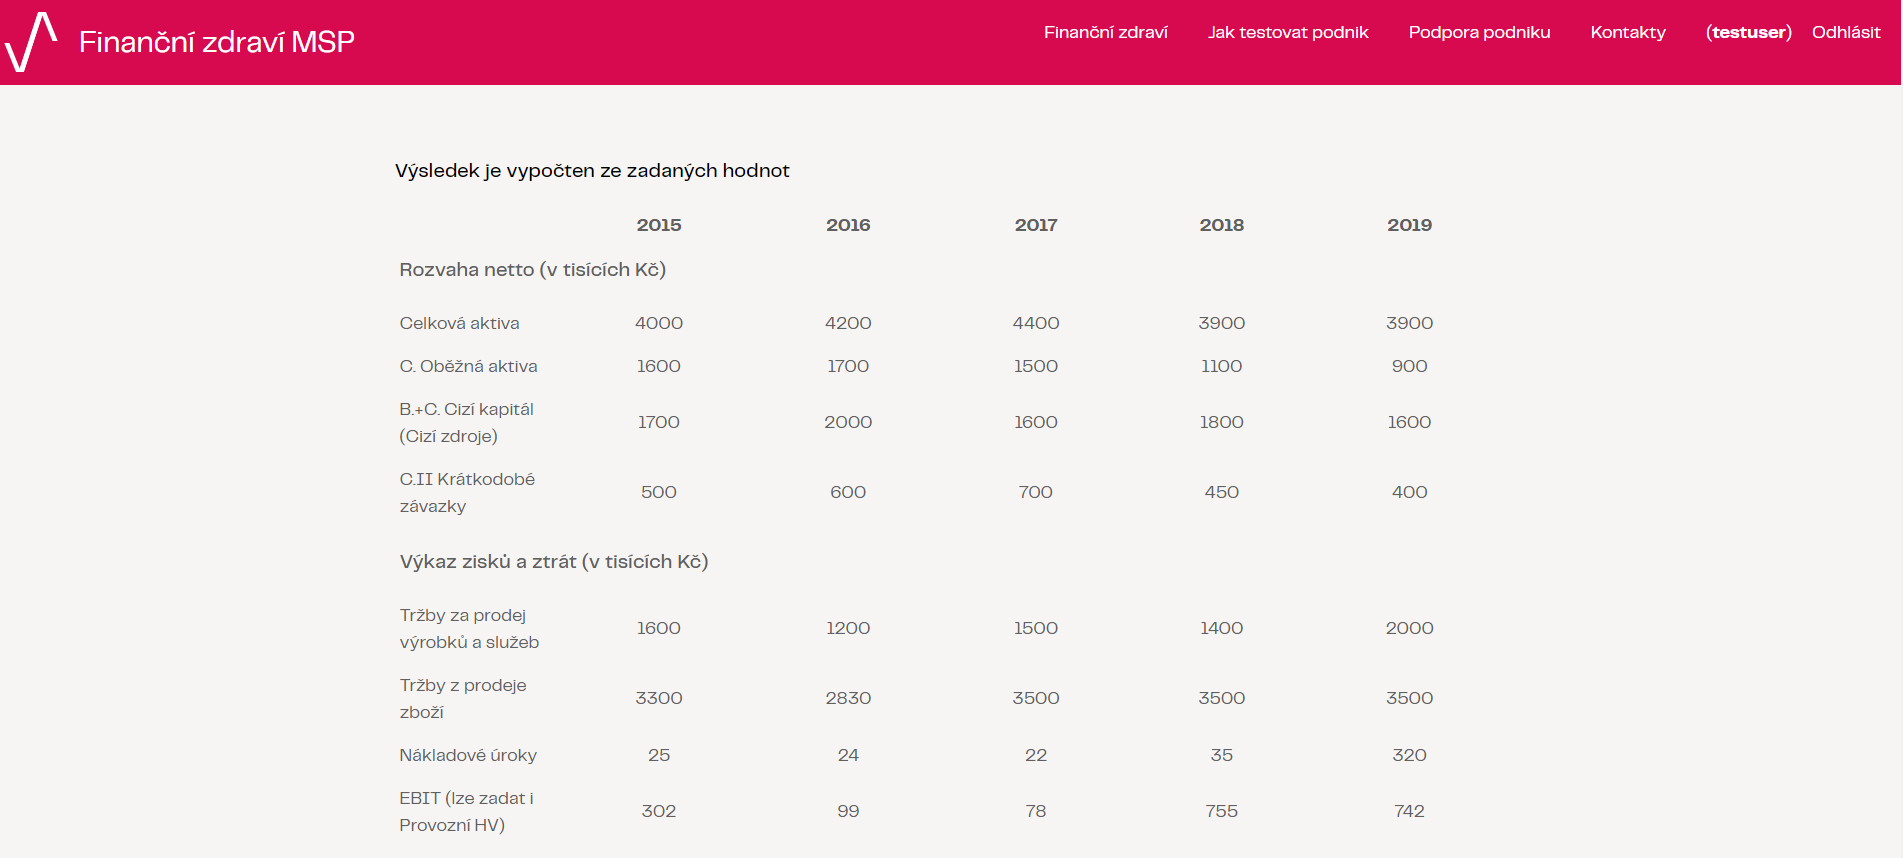
The app then produces a graph based on a very simple idea.
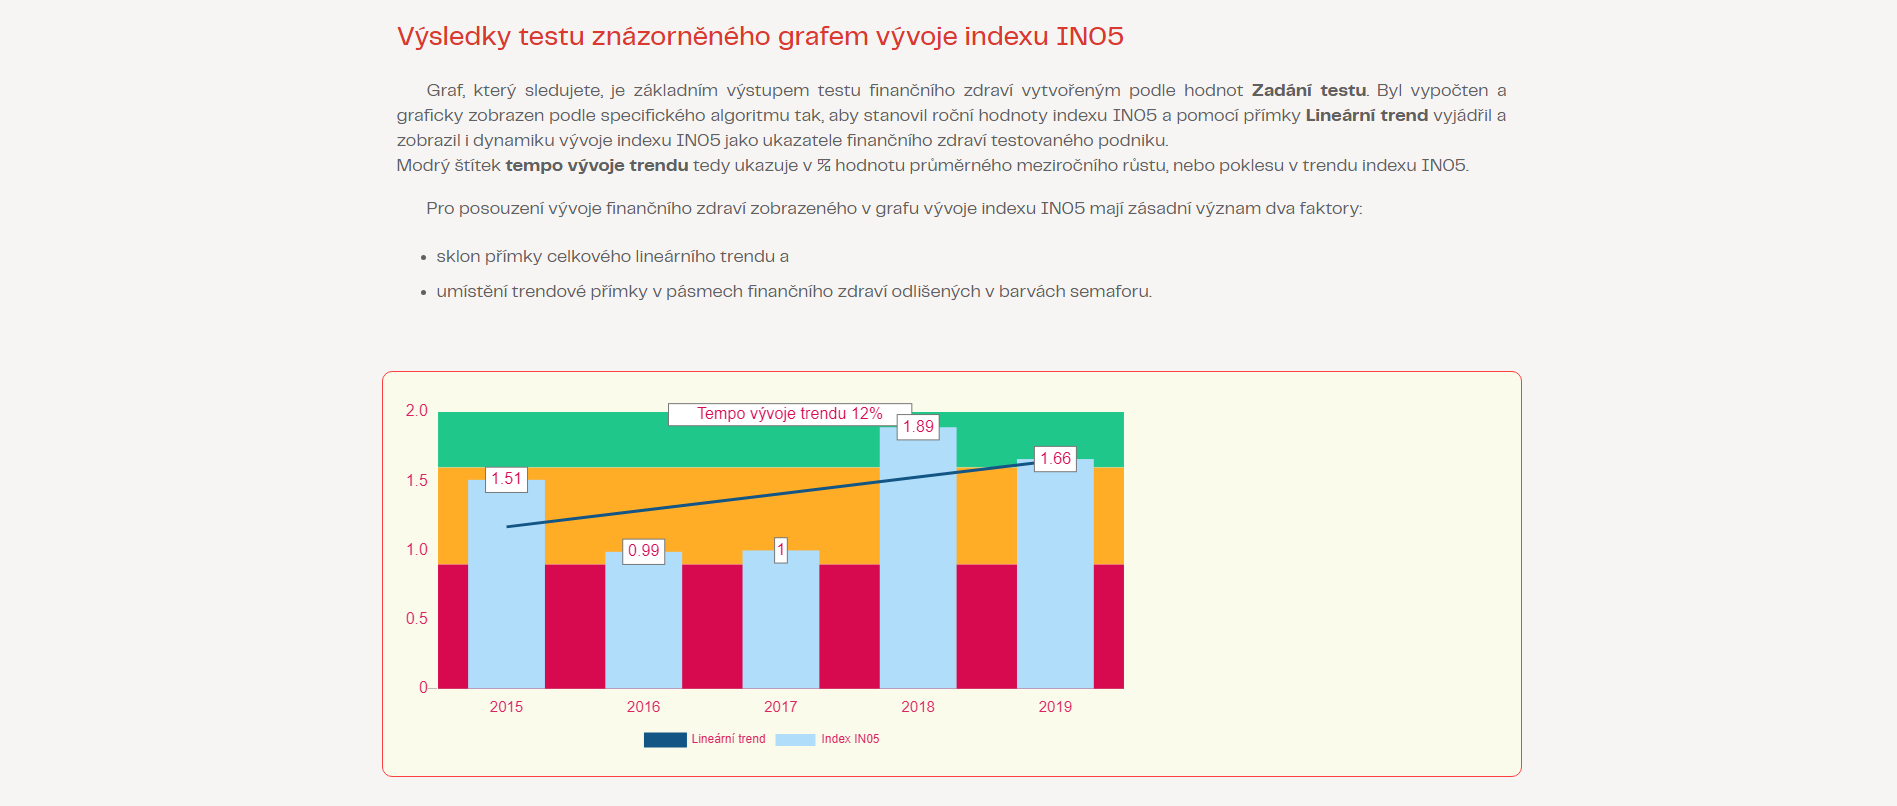
When the line falls, your company’s financial health declines. When it rises, financial health improves. But you also need to look at the band in which the line sits. It works like traffic lights: red means inadequate financial health, amber means uncertain financial health and green means sound financial health. All indicators and possible analysis results are clearly explained in the app.
If you do not like reading graphs, you can go straight to the written assessment of your data. This includes both an evaluation of financial health in previous years and recommendations for the years ahead.
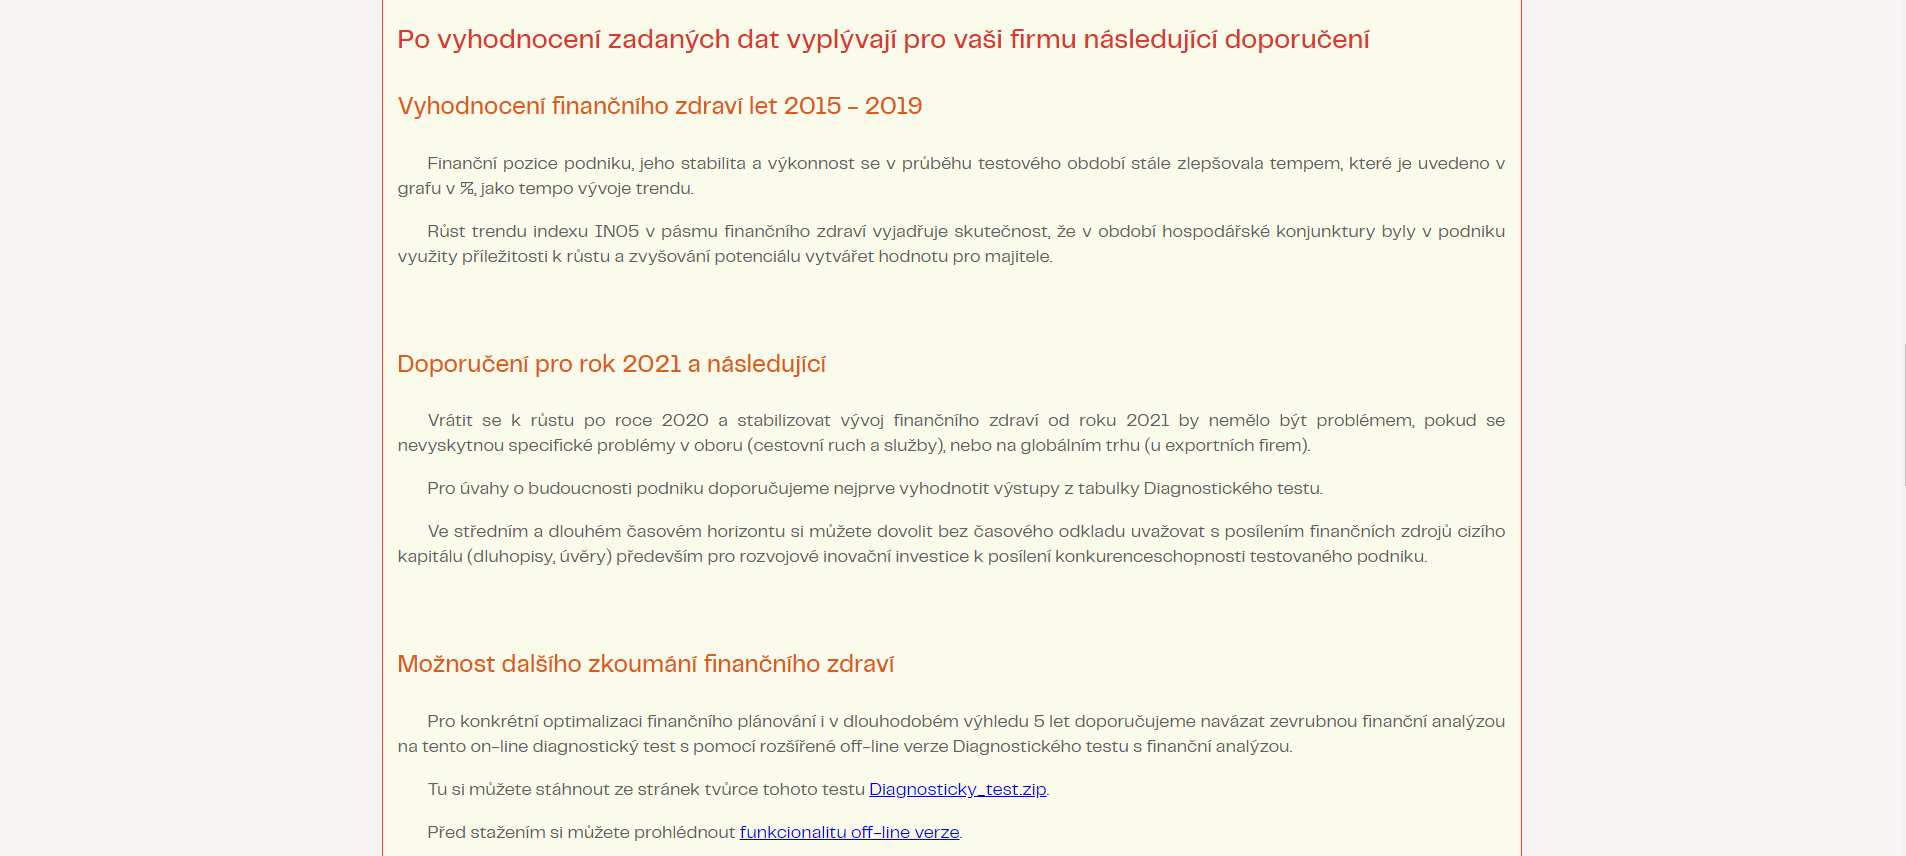
If these results are not enough, you can also use the extended version of the test with financial analysis.
Want to take the test but unsure how? Send us the necessary documents and, as part of a consultation, we will be happy to prepare it for you. 🙂